By LI GANG
![]()
![]()
By LI GANG
THE European Union’s advanced technology, skilled labor force, transparent legal environment, and relatively easy market access make it the preferred investment destination for Chinese investors. European countries, meanwhile, welcome investment from Chinese enterprises, because it promotes economic recovery and growth and creates more employment opportunities. At present, China occupies one tenth of the global economy, yet its outward investments account for just 1.5 percent of the global total FDI. China’s investment potential in Europe is consequently enormous. New York-based international advisory body Rhodium Group estimates that between 2012 and 2020, China’s accumulated FDI in Europe will reach between US $250 billion and US $500 billion.
Increasing investment in Europe will give China access to the continent’s high technology and advanced managerial experience, dilute the risks associated with its vast foreign exchange reserves, and also help diffuse dissatisfaction among certain Europeans over the long-standing problem of trade deficits.
Investment in Core Countries
|
 |
|
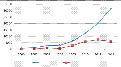
2005-2012 China’s Direct Investment Stock and Direct Investment Flows to EU (unit: US $1 million)Source: MOFCOM, National Bureau of Statistics and SAFE: 2012 Statistical Bulletin of China’s Outward Foreign Direct Investment, China Statistics Press, 2013 |
In 2005, China’s FDI in the EU totaled US $768 million, accounting for just 1.3 percent of its FDI as a whole, according to the 2012 Statistical Bulletin of China’s Outward Foreign Direct Investment, released by the Ministry of Commerce and National Bureau of Statistics. One year later, investments in Europe had reached US $1.275 billion, a year-on-year growth of 66 percent. Contrary to what might be expected, after the outbreak of the European debt crisis, China increased rather than reducing its EU investments, so bringing about a surge in development. Those in 2009 reached US $6.278 billion, almost double the 2008 amount. By the end of 2012, China’s FDI stock in the EU stood at US $31.538 billion, a 40-fold increase over the 2005 level, accounting for 5.9 percent of China’s total FDI.
Although the years 2005 to 2012 saw fluctuations in China’s direct investment flows to the EU, it nonetheless fundamentally appeared as a rising trend. A historical change occurred in 2010, when China’s FDI flows to Europe exceeded those from the EU to China, peaking at US $7.561 billion in 2011 – almost 60 times that in 2006. Growth of China’s investment in Europe was apparent in the escalation of Chinese enterprises entering Europe. In 2010 there were 4,525 Chinese direct investment enterprises on the continent with total assets of €15.178 billion. By the end of 2012 they had proliferated to 7,148, registered in 35 European countries, with assets worth €87.8 billion, according to the Euro-China Investment Report 2013/2014 released by the Antwerp Management School.
Although China’s investment in Europe has ballooned, it nonetheless remains at the initial stage, both sides figuring equally low on the bilateral investment scale. There is consequently huge potential for growth. Ministry of Commerce statistics show that, in 2012, China’s FDI stock in the EU totaled US $31.538 billion, accounting for 5.9 percent of its global sum, and that the country’s investment flows to the EU amounted to US $6.12 billion, accounting for seven percent of its world total. During the same period, China’s FDI stock in the U.S. totaled US $17.08 billion, its investment flows there amounting to US $4.048 billion. At the end of 2012, EU direct investment stock in China stood at €118.1 billion, less than one percent of the EU’s total FDI, according to Eurostat information on EU direct investment in China. The stocks of EU FDI in the U.S., meanwhile, totaled €1.7 trillion, accounting for 13.4 percent of EU outward FDI. The year 2012 saw an increase in net flows of EU FDI to China of €15.516 billion, accounting for 3.7 percent of the total, as compared to an increase in net flows to the U.S. of €62.903 billion, accounting for 15 percent of total net flows of EU FDI. The bilateral FDI disparity between China and the EU and their economic aggregates is thus clear. Both sides hence have ample scope for increased investment.
The pentagon-shaped area comprising the five cities of London, Hamburg, Munich, Milan and Paris possesses advanced technologies and strong industrial competitiveness that most attract foreign investments. As Chinese investors are drawn to companies with advanced technologies and famous brands, they tend to select those in Europe’s core countries, such as UK, France and Germany.
Rhodium Group statistics show that, from 2000 to 2011, China’s newly increased FDI in the EU added up to US $20.957 billion (with 573 new projects), with that in France to US $5.722 billion (with 70 projects); that in the UK to US $3.684 billion (95 projects); and that in Germany to US $2.543 billion (146 projects). Ministry of Commerce data show that at the end of 2001, China’s direct investment stock reached more than US $1 billion in six EU members, namely, Luxembourg (US $8.978 billion), UK (US $8.934 billion), France (US $3.951 billion), Germany (US $3.104 billion), Sweden (US $2.408 billion) and the Netherlands (US $1.108 billion).